Monday, December 16, 2013

Echoes, T2 Measurements and Diffusion

In a perfectly homogeneous magnetic field, the T2 relaxation time constant can be measured directly from the free induction decay in the time domain or the full width at half height of the resonance in the frequency domain.  The magnetic field however, is never perfectly homogeneous.  Each microscopic volume element of the sample resides in a slightly different magnetic field and therefore the offset frequencies of the resonance in each volume element are slightly different from one another.  The net effect on the spectrum of the entire sample is that the NMR resonances are broader than what one would expect from the T2 relaxation process alone.  The distribution of offset frequencies due to magnetic field inhomogeneity is referred to as inhomogeneous broadening.  In an inhomogeneous magnetic field, the FID decays faster, with time constant T2* where 1/T2* has a contribution from the natural relaxation rate, 1/T2, of the resonance and that due to the field inhomogeneity.  In other words, when a sample is in an inhomogeneous magnetic field, the resonances are homogeneously broadened by the natural T2 relaxation process and inhomogeneously broadened by the non-uniform magnetic field.  The measurement of T2 relies on separating the homogeneous broadening from the inhomogeneous broadening.

One of the first pulse sequences typically introduced in NMR textbooks is the spin echo or Hahn echo.  This sequence consists of a 90° pulse followed by a delay, τ, during which offsets frequencies evolve.  A 180° pulse is then applied after which another period of time, τ is allowed where offsets continue to evolve, producing an echo at 2τ. The spin echo sequence has the ability to refocus the distribution of offset frequencies due to magnetic field inhomogeneity (inhomogeneous broadening) however it cannot refocus the natural distribution of frequencies due to the T2 relaxation process (homogeneous broadening).  It would seem as if the spin echo sequence has the ability to separate out the homogeneous broadening from the inhomogeneous broadening and therefore should be able to be used to measure the T2 relaxation time constant in a scheme like the one shown in the figure below.


where the intensity of the signals as a function of 2τ is fitted to an exponential decay to give T2.  Can this sequence really be used to measure T2?  Let's look a bit deeper.

A sample of tetrakis-trimethylsilyl silane ( Si(Si(CH3)3)4 ) was dissolved in CDCl3.  The magnet was shimmed such that the full line width at half height of the 1H resonance was 2 Hz.  A standard one-pulse proton spectrum and a Hahn echo spectrum (with τ set to 1 second) were collected.  The same measurements were made after adjusting the magnetic field shims such that the full width at half height was 5 Hz and 13 Hz.  The results are shown in the figure below.


The top panel shows the NMR spectra resulting from the one-pulse measurement.  The spectra all have the same integrated area as expected.  The middle panel shows the FID's from the one-pulse measurements.  The initial intensity of each FID is the same since the initial intensity of the FID is proportional to the integrated area of the resonance in the frequency domain.  The bottom panel shows the Hahn echoes collected with a value of τ =1 second (a value substantially shorter than T2).  The receiver was turned on immediately after the 180° pulse to collect the entire echo.  Unlike the one-pulse FID's which remained constant as a function of magnetic field inhomogeneity, the height of the Hahn echoes decreased as the magnetic field inhomogeneity increased, all other parameters being constant.  This should convince you that the simple Hahn echo is not always suitable for T2 measurements as the intensity of the echo depends on the degree of inhomogeneous broadening.  This is so because of molecular diffusion.  During the one second τ delays, molecules move from one volume element to another in the sample and therefore change their offset frequencies over the course of the measurement.  The net result for the entire sample leads a loss in echo intensity due to destructive interference in the time domain signal from the sum of all volume elements.  The loss in echo intensity is worse the more inhomogeneous the field.  The simple Hahn echo would be expected to work as a means to measure T2 only in cases where the diffusion is insignificant with respect to τ (solids or dissolved macromolecules). 

How then are T2's measured for small molecules in solution where diffusion is fast?  One uses a train of Hahn echoes where the τ delays for each echo are chosen sufficiently short such that diffusion is not a problem (typically on the order of msec or tens of msec).  The T2 is calculated from a series of spectra collected as a function of the number of echoes in the train based on the overall time between the initial 90° pulse and the collection of the signal.  Such a scheme is called a Carr Purcell Meiboom Gill (CPMG) sequence and is shown in the figure below.


Wednesday, October 23, 2013

FSLG CP HETCOR

Solid-state 1H MAS NMR spectra with resolution comparable to that obtained for liquids, are difficult (if not impossible) to obtain. The main problem is that magic angle spinning is unable to average the homonuclear 1H dipolar coupling interaction to zero.  The combined use of MAS and multiple pulse decoupling schemes (CRAMPS) can be used to improve the resolution.  In this case, the 1H FID is sampled during windows of the multiple pulse decoupling scheme where pulses are not being delivered, however the attainable resolution is still much less that that observed for liquids where the rapid molecular tumbling reduces the homonuclear dipolar interaction to zero.  Furthermore, CRAMPS experiments can be difficult to setup and run.  An alternative method of obtaining "high resolution" solid-state 1H NMR spectra (with resolution comparable to that of a CRAMPS spectrum) is a frequency switched Lee-Goldburg cross polarization heteronuclear correlation experiment (FSLG CP HETCOR) where the 1H spectrum is obtained in the indirect dimension of a 2D experiment.

In this pulse scheme, used in conjunction with MAS, 1H magnetization is aligned at the magic angle and subjected to FSLG decoupling where it is forced to precess about a field oriented at the magic angle by using 2π pulses with carefully chosen offset frequencies.  The ideal effect is to average the homonuclear dipolar coupling to zero.  The FSLG decoupling train serves as the evolution time (t1) in a 2D data collection scheme.  During the variable evolution period the 1H chemical shifts evolve while the heteronuclear dipolar coupling is averaged by MAS and the homonuclear dipolar coupling is averaged by both the MAS and the FSLG pulse train.  The 1H magnetization is then returned to the transverse axis and cross polarization (CP) is used to transfer the frequency encoded proton magnetization to 13C.  The 13C FID is observed while 1heteronuclear decoupling is applied.  If CP contact times are chosen sufficiently short, one obtains a 2D 13C-1H dipolar correlation map with correlations present between carbon resonances and the protons to which they are most strongly dipolar coupled.  If longer contact times are used, more correlations will appear resulting from longer range dipolar couplings and 1H spin diffusion.  In either case, the 1H projection of the data represents a high resolution 1H spectrum of the sample with resolution comparable to or better than a CRAMPS spectrum.  The figure below shows FSLG 13C-1H CP HETCOR spectra for Dianin's compound acquired on a 200 MHz spectrometer using a spinning speed of 5 kHz.

The spectrum on the right was acquired with a 50 µsec contact time and shows the aromatic carbon resonances correlated to aromatic proton resonances and the aliphatic carbon resonances correlated with the aliphatic proton resonances.  The spectrum on the left was acquired with a 300 µsec contact time and shows all of the 13C resonances correlated to all of the 1H resonances.  In both cases the 1H projection is a high resolution 1H NMR spectrum.

Friday, July 19, 2013

Understanding NMR Spectroscopy

Undergraduate students are typically introduced to the subject of NMR spectroscopy through the organic chemistry curriculum where, after a brief introduction to the technique, they learn how to interpret chemical shifts, coupling constants and NOE's in terms of chemical
information. Unfortunately, this is often the extent of a students training in NMR despite the fact that many who pursue graduate studies use NMR spectroscopy every day.  These students learn to operate NMR spectrometers and will agree that NMR spectroscopy is by far the most valuable technique for characterizing their chemical compounds yet most lack a fundamental understanding of the technique.  It cannot be disputed that an understanding of the fundamentals of NMR enables the chemist to become a confident, knowledgeable NMR user able to gain the maximum amount of information from NMR results.

In my opinion, by far, the best NMR book devoted to the fundamentals of NMR spectroscopy published in the last 10 years is James Keeler's book, Understanding NMR Spectroscopy (my copy is well worn).  Although it is limited to spin-1/2 nuclides and does not cover solid state NMR, it covers the fundamentals of NMR in a very clear understandable way.  Keeler has a talent for teaching and makes the material accessible to all with a basic science background.  After studying this book the reader will gain a much better understanding of one- and two-dimensional pulse sequences, product operators, relaxation, nuclear Overhauser effects and coherence selection through both phase cycling and pulsed field gradients.


In addition to the book, a detailed set of notes is available on Dr. Keeler's web site and recently, an entire course given by Keeler, consisting of 14 lectures, has appeared on YouTube.  Links to the lectures are as follows:

1.                 Energy levels
2.                 The Vector Model
3.                 Fourier Transformation
4, 5, 6          Product Operators
7, 8              Two-Dimensional NMR
9, 10, 11      Relaxation
12, 13, 14    Coherence Selection

I highly recommend the book, and the lectures.  Never has understanding NMR spectroscopy been more accessible.

Thursday, June 13, 2013

Manual Phase Correction of 1D Spectra - Video Tutorial

In some cases where there are baseline issues, automatic phase correction may not do a satisfactory job.  It then becomes necessary to correct the phase manually.  The following video demonstrates how to manually phase correct a 1D NMR spectrum in TOPSPIN.

Tuesday, June 4, 2013

Bruker Fourier 300 NMR Spectrometer in the Undergraduate Lab

The Department of Chemistry undergraduate laboratory at the University of Ottawa is equipped with a Bruker Fourier 300 NMR spectrometer which is used by each of the undergraduate chemistry students requiring NMR data.


To minimize the amount of training for new students and maximize the throughput during the busy laboratory periods, we have implemented a simplified data collection scheme called EZNMR.  The following tutorial video was prepared for the undergraduate students who have yet to run their first 1H NMR spectrum.

Friday, April 5, 2013

Removing t1 Noise from Homoonuclear 2D NMR Data - Video Tutorial

The often troublesome stripes of vertical noise in 2D NMR spectra are called t1 noise (i.e. noise originating in the t1 domain). When t1 noise occurs in homoonuclear 2D correlation experiments such as COSY, TOCSYNOESY or ROESY, symmetrization can be used to remove a great deal of the noise and make the data more presentable. The technique was described in a previous post and is demonstrated in this video tutorial using a magnitude COSY spectrum as an example.


Thursday, April 4, 2013

Cable Length and Probe Tuning

NMR probes can be tuned and matched on the bench or while in the magnet using a sweep generator and oscilloscope.  More typically, probe tuning and matching are monitored using the electronics in the NMR console and preamplifier.  In either case, it is important to realize that any filter or cable between the preamplifier and the probe is part of the rf circuit being tuned and should therefore be present while adjusting the tuning and matching capacitors of the probe.  This is illustrated in the figure below.  An NMR probe was tuned and matched using the wobble function of a Bruker AVANCE spectrometer. There was a bandpass filter and a short cable between the preamplifier and the probe.  The tuning curve is shown in the top of the figure.  The 90° pulse was measured at 11.25 μsec. The short cable was then replaced with a long cable and the probe tuning and matching capacitors were left unchanged.  The tuning curve is shown in the bottom of the figure below.  It is clear that the overall circuit is no longer tuned and matched.  The 90° pulse was measured at 13.75 μsec using the long cable.

Tuesday, March 26, 2013

Removing t1 Noise from Heteronuclear 2D NMR Data - Video Tutorial

The often troublesome stripes of vertical noise in 2D NMR spectra are called t1 noise (i.e. noise originating in the t1 domain). When t1 noise occurs in hereronuclear 2D correlation experiments such as HMBC, HSQC, HMQC or HOESY, there is a simple trick to remove a great deal of the noise and make the data more presentable. The technique was described in a previous post and is demonstrated in this video tutorial using a 19F - 1H HOESY spectrum as an example.

Monday, March 18, 2013

Exponential Line Broadening - Video Tutorial

Exponential line broadening is an important NMR data processing tool.  It involves multiplying the time domain signal by a decaying exponential function prior to Fourier transforming the data into the frequency domain.  It is used to improve the signal-to-noise ratio and is more fully described in a previous post.  The following short tutorial video demonstrates its use.


Wednesday, March 13, 2013

Phasing a 2D NMR Spectrum - Video Tutorial

The following video demonstrates how to phase a 2D NMR spectrum in TOPSPIN 3.

Thursday, March 7, 2013

Thermal Noise in NMR Data

The University of Ottawa has recently been funded for a 600 MHz NMR spectrometer with a cryogenically cooled probe.  Cryoprobes differ from conventional NMR probes in that the rf circuits and preamplifiers are cooled with cold helium gas while the sample is maintained at ambient temperature.  The benefit of cryogenically cooled electronics compared to room temperature electronics is that the thermal noise in the system is reduced at cryogenic temperatures while the NMR signal remains constant for the sample at ambient temperature.  The signal-to-noise ratio in an NMR spectrum acquired in a cryoprobe is therefore increased dramatically compared to a conventional probe, typically by a factor of 4.  This allows for data collection times on the order of 16 times shorter than those using conventional probes as well as lower detection limits.  This principle can be crudely demonstrated by replacing the NMR probe with a 50 Ω  load and collecting "NMR" data on the load at both high and low temperatures.  The "NMR spectra" in the figure below were collected (without using an rf pulse) on a 50 Ω load outside of the magnet at room temperature (left panel) and in a dewar of liquid nitrogen at 77 K (right panel).  The noise collected in the 77 K spectrum is 35% lower than that in the room temperature spectrum demonstrating the lower thermal noise at lower temperatures.


This effect is dramatically increased in a crypoprobe which cools the electronics of both the rf probe circuits and preamplifiers to temperatures much lower than 77 K.

Thursday, February 14, 2013

Receiver Gain and Signal-to-Noise Ratio

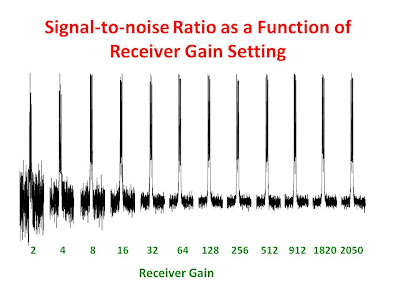
The signal-to-noise ratio in an NMR spectrum can be affected drastically the choice of the receiver gain setting, so care should be taken to set the receiver gain correctly for optimum results.  At very low receiver gain settings, both the signal and the noise use only a fraction of the available digitization levels of the analog-to-digital concertor (ADC).  As a result, the intensity of each point in the FID is represented with only a few possible values and the FID is "choppy".  This is analogous to a black and white photograph being represented with a coarse gray scale of only a few shades of gray.  Just like such a poorly represented photograph, the NMR spectrum contains a great deal of digital noise and therefore a low signal-to-noise ratio.  As the receiver gain is increased, the FID is digitized with more available digitization levels.  Since the thermal noise in the FID at low receiver gain settings is smaller than or comaparable the size of the digitization step of the ADC, the noise (unlike the signal) will not be amplified by increasing the receiver gain until it exceeds the size of the digitization step of the ADC after which it will be amplified in the same way as the signal.  As a result, the signal increases more so than the noise as the receiver gain setting is increased therefore, the signal-to-noise ratio in the NMR spectrum increases steadily as the receiver gain setting is increased.  As the receiver gain is increased beyond the point where the thermal noise exceeds the size of the digitization step, both the sginal and the noise can be digitized properly and the signal-to-noise ratio increases much less as a function of receiver gain setting increase.  If the receiver gain is increased too much, the signal will exceed the limits of the ADC, the FID will be clipped at the beginning and the NMR spectrum will be severely distorted.  The first figure below shows a series of spectra plotted as a function of the receiver gain setting.  The spectra were scaled such that the signals were all of the same height.  It is clear that the signal-to-noise ratio increases initially and then levels off.  The data are plotted in the second figure.
   

Wednesday, January 23, 2013

DNP-NMR

Dynamic nuclear polarization (DNP) is a signal enhancement technique becoming more and more important in NMR studies of biological samples and materials.  Enhancement of NMR signals is accomplished by doping samples with stable free radicals.  The trapped free radicals in the cooled solid sample are irradiated continuously at the EPR microwave frequency.  Microwaves are generated by a gyrotron (which requires iits own superconducting magnet in addition to the superconducting NMR magnet).  The microwave radiation is introduced into the NMR probe by way of a wave guide.  While the unpaired electrons are irradiated, the population distribution of the Zeeman states of NMR active nuclei are modified providing more polarization and therefore a large NMR sensitivity enhancement.  Typically the polarized protons in the sample are used as a cross polarization source for less abundant nuclides.  The data are typically acquired at low temperature with magic angle spinning.  The overall NMR enhancement is typically one or two orders of magnitude when one compares NMR spectra acquired with the microwave source on vs off.  Commercial DNP-NMR instruments are now available.

Thorsten Maly authors a very informative BLOG on all things DNP-NMR.  I encourage you to take a look at it.