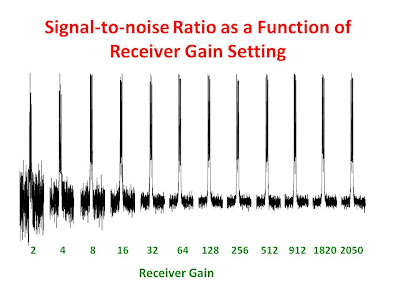
The signal-to-noise ratio in an NMR spectrum can be affected drastically the choice of the receiver gain setting, so care should be taken to set the receiver gain correctly for optimum results. At very low receiver gain settings, both the signal and the noise use only a fraction of the available digitization levels of the analog-to-digital concertor (ADC). As a result, the intensity of each point in the FID is represented with only a few possible values and the FID is "choppy". This is analogous to a black and white photograph being represented with a coarse gray scale of only a few shades of gray. Just like such a poorly represented photograph, the NMR spectrum contains a great deal of digital noise and therefore a low signal-to-noise ratio. As the receiver gain is increased, the FID is digitized with more available digitization levels. Since the thermal noise in the FID at low receiver gain settings is smaller than or comaparable the size of the digitization step of the ADC, the noise (unlike the signal) will not be amplified by increasing the receiver gain until it exceeds the size of the digitization step of the ADC after which it will be amplified in the same way as the signal. As a result, the signal increases more so than the noise as the receiver gain setting is increased therefore, the signal-to-noise ratio in the NMR spectrum increases steadily as the receiver gain setting is increased. As the receiver gain is increased beyond the point where the thermal noise exceeds the size of the digitization step, both the sginal and the noise can be digitized properly and the signal-to-noise ratio increases much less as a function of receiver gain setting increase. If the receiver gain is increased too much, the signal will exceed the limits of the ADC, the FID will be clipped at the beginning and the NMR spectrum will be severely distorted. The first figure below shows a series of spectra plotted as a function of the receiver gain setting. The spectra were scaled such that the signals were all of the same height. It is clear that the signal-to-noise ratio increases initially and then levels off. The data are plotted in the second figure.
Subscribe to:
Post Comments (Atom)


No comments:
Post a Comment