
Thursday, September 27, 2007
The Effect of Floor Vibrations on NMR Spectra
NMR spectra are very sensitive to floor vibrations. This can be a problem especially when the equipment is installed on the upper floors of a building. The proton spectra of chloroform in the figure below were acquired on our INOVA 500 in room 416 of D'Iorio Hall. The left hand spectrum was acquired with the vibration isolation mounts of the magnet pumped up with air. The spectrum on the right was acquired under identical conditions with the magnet sitting on the floor.
Wednesday, September 26, 2007
The Effects of Bad Shimming
When the magnet shims are not optimized, the lines in your NMR spectra can take on distinct shapes. The shape of the peak will give you a hint as to which shims need adjustment. Note that lineshapes can also be much more complicated than those below and can even show splittings.

If you have used gradient shimming or another type of auto-shimming and you have peculiar line shapes, then you should check the following:
1. Was the depth set correctly on the tube?
2. Does the tube have a column of solution of approximately 5 cm? Tubes that are underfilled or overfilled will cause problems.
3. Is the sample well mixed? (see BLOG entry for September 4, 2007).
4. Is the solution cloudy?
5. Are there floaters or sinkers?
6. Is the sample paramagnetic?
7. Is there any slow chemical or dynamic exchange?
Monday, September 24, 2007
External Chemical Shift Referencing
When you run your proton and carbon-13 NMR spectra, you usually reference the chemical shifts to TMS at 0 ppm or to the resonances of the solvents whose chemical shifts are known with respect to TMS. What do you do if there is no internal reference in your sample? For example, if you are running a 31P, 19F or 11B NMR spectrum, how do you calibrate the chemical shift scale? One way, of course, is to put an internal standard in your sample. You can also reference the chemical shifts externally to a standard sample. Here is what you must do to reference your chemical shifts externally on any of our Bruker spectrometers.
1. Lock and shim your sample as usual. If you are not using a deuterated solvent then you should lock and shim on a sample filled to the same level as your sample containing the deuterated version of the protonated solvent you are using in your sample.
2. Push the "lock" button on the BSMS hand controller such that the "lock" light is NOT illuminated.
3. Push the "sweep" button on the BSMS hand controller such that the "sweep" light is NOT illuminated. (Steps 2 and 3 can also be carried out by clicking on the "Run Unlocked" button on the command panel)
4. Run the spectrum of your sample.
5. In another experiment, run the standard sample. Do not try to lock or shim.
6. Calibrate the chemical shift in the spectrum of the reference compound. For example for 31P NMR, the accepted reference is 85% phosphoric acid at 0 ppm.
7. Type "sr" and write down the number the spectrometer reports.
8. Return to the experiment where your sample was run.
9. Type "sr" and enter the number you recorded in step 7. Your spectrum is now referenced.
Friday, September 21, 2007
Missing Signals in HMBC Data
The HMBC sequence is very useful at establishing long range correlations between protons and carbon. It is particularly useful at finding carbonyl or quaternary carbons when only small amounts of sample are available. The HMBC spectrum has the same appearance as an HMQC or HSQC spectrum except that the responses are between protons and carbon separated by 2, 3 or possibly even 4 bonds. People often ask why are some signals missing from the data? Like the DEPT experiment discussed yesterday, the HMBC sequence is optimized for a particular coupling constant (usually about 10 Hz). If the long range proton-carbon coupling is close to zero then the signal will be absent from the spectrum. Such absences can give you valuable structural information as 3 bond proton-carbon coupling follows a Karplus type relationship.
Thursday, September 20, 2007
Signal Intensity (or Missing Signals) in DEPT Spectra
I often get asked by students: Why does my terminal alkyne carbon not show up in my DEPT spectrum? The answer lies in the DEPT pulse sequence which uses a delay based on a multiple of the reciprocal of the average one bond carbon-proton coupling constant. Carbon-proton coupling constants span more than 100 Hz with an average of 145 Hz. The DEPT sequence you use is optimized for this average coupling constant. Carbon signals with couplings significantly different than 145 Hz will be attenuated in the spectrum.

In the lower trace of the above figure is a simulated DEPT 135 spectrum of the indicated fictitious molecule with the one bond carbon-proton couplings set to typical values as follows:
1 250 Hz
3 125 Hz
4 125 Hz
5 125 Hz
6 118 Hz
Note that the terminal alkyne signal is very small. In a real spectrum, this signal could easily be lost in the noise. The upper trace is a similar simulated spectrum where all of the couplings were set to 145 Hz (note the gain in signal strength for the terminal alkyne resonance). Take note that the silyl methyl signals suffer less from this effect than does the terminal alkyne as its coupling constant is much closer to 145 Hz than that of the terminal alkyne.
Take-home message - Expect attenuation in carbon signals in a DEPT spectrum if the one bond carbon-proton coupling constant differs significantly from 145 Hz.
Wednesday, September 19, 2007
Exponential Line Broadening
If you have a spectrum with a poor signal-to-noise ratio or a spectrum containing a very broad resonance (due to slow molecular motion for example), you will probably be able to get higher quality data by using exponential line broadening. This is a very common data processing technique where the FID is multiplied by a decaying exponential function (the Fourier transform of which is a Lorentzian line with a full width at half height of LB). The larger LB, the faster the decay of the exponential. The product of the FID with the exponentially decaying function is Fourier transformed to give the NMR spectrum.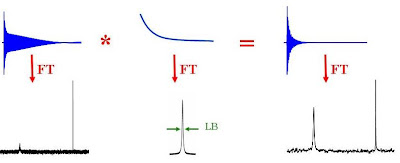 Since the signal-to-noise ratio of the FID is worse near the end than at the beginning, multiplying by the exponential decay effectively improves the overall signal to noise ratio. Broad signals tend to show up better as broad lines have very rapidly decaying FID's and hence the multiplication of the FID by an exponential emphasizes the faster decaying components of the FID.
Since the signal-to-noise ratio of the FID is worse near the end than at the beginning, multiplying by the exponential decay effectively improves the overall signal to noise ratio. Broad signals tend to show up better as broad lines have very rapidly decaying FID's and hence the multiplication of the FID by an exponential emphasizes the faster decaying components of the FID.
All things come at a price. Application of exponential line broadening will decrease the resolution in your NMR spectrum.
How do I use it intelligently?
In TOPSPIN or XWINNMR type:
"lb 0"
"lb 0"
"efp"
"apk"
Using the cursors, measure the line width at half height of the narrowest line of interest. Input approximately 75% of this value as "lb". For example, if the narrowest line of interest was 1 Hz, set lb to 0.75.
type:
"lb=0.75"
"efp"
"apk"
Tuesday, September 18, 2007
Proton NMR of TMS
The proton NMR signal of TMS is a singlet at 0 ppm ..... right? - WRONG!
Naturally occurring TMS is a mixture of isotopomers. Silicon is 92.2% silicon -28 (I = 0), 4.7% silicon-29 (I = 1/2) and 3.1 silicon-30 (I = 0). Carbon is 98.9% carbon-12 (I = 0) and 1.1% carbon-13 (I = 1/2). Each isotopomer has a different NMR spectrum. The protons are coupled to both 13C and 29Si but not 12C and 28Si.The figure below shows a 400 MHz proton NMR spectrum of TMS. The major isotopomers responsible for the lines are labelled.
Monday, September 17, 2007
Resolution Enhancement
If you have a partially resolved multiplet or partially resolved chemical shifts, you can enhance the resolution in the spectrum by treating your free induction decay with exponential and Gaussian functions before Fourier transformation. The upper trace of the figure below is the proton spectrum of benzene-d5 (i.e. C6D5H). The lower trace is the same data after treatment of the FID with a mixture of Gaussian and exponential functions. The signal in the resolution enhanced spectum shows the expected 1:2:3:2:1 multiplet due to H-D coupling. The enhancement of resolution is at the expense of the signal-to-noise ratio and quantitation. You can easily use this for your own data using TOPSPIN or XWINNMR as follows:
"lb -1" (The more negative lb - the more resolution enhancement)
"gb 0.4" (gb is a value between 0 and 1. The larger the number, the more resolution enhancement)
"gm" (This command calculates the Gaussian weighted FID)
"ft" (This command carries out the Fourier transform)
"apk" (This command calculates the proper phase correction. You may have to phase the spectrum manually)
Try it on your own data with different values of "lb" and "gb" to get a feel for what it can do for you.
To learn more about what you are doing, read the online TOPSPIN manual or take CHM 4380/8309B.
You can easily use this for your own data using TOPSPIN or XWINNMR as follows:"lb -1" (The more negative lb - the more resolution enhancement)
"gb 0.4" (gb is a value between 0 and 1. The larger the number, the more resolution enhancement)
"gm" (This command calculates the Gaussian weighted FID)
"ft" (This command carries out the Fourier transform)
"apk" (This command calculates the proper phase correction. You may have to phase the spectrum manually)
Try it on your own data with different values of "lb" and "gb" to get a feel for what it can do for you.
To learn more about what you are doing, read the online TOPSPIN manual or take CHM 4380/8309B.
Friday, September 14, 2007
Width of Residual Proton Resonances for Chloroform-d and Benzene-d6
I often ask students: why is the residual proton resonance of benzene-d6 so much broader than that of chloroform-d? It is surprising how few can provide an answer. The figure below shows the signals from both solvents on the same scale. The answer is below.

The proton signal for the 99.6% D benzene-d6 is due to C6D5H. The lone proton on the benzene ring is coupled to the deuterons on the ring. If you look closely at the resonance, you can see partially resolved coupling as bumps on the side of the signal and a distinctly non-Lorentzian shape. If the coupling of the proton to the meta and para deuterons can be neglected, we would expect the resonance to be a 1:2:3:2:1 quintet due to coupling to the ortho deuterons.
The signal from 99.8% D chloroform-d on the other hand is due to CHCl3 (ordinary chloroform). There is no H-D coupling and as a result the resonance is sharper.
Thursday, September 13, 2007
Isotope Shifts for Chloroform
Yesterday, an observant student asked me why she frequently sees a small peak in the triplet for CDCl3 in the 13C spectrum. 
The small peak is due to a small amount of CHCl3 in the CDCl3 solvent. The CHCl3 signal is a singlet because proton decoupling was used to collect the data. The CDCl3 signal is a 1:1:1 triplet due to the J coupling to the deuteron which is a spin I=1 nucleus having three energy levels. The chemical shift difference between the CHCl3 and CDCl3 isotopomers is called an isotope shift.
Question 1: Since chlorine has two NMR active isotopes (35Cl and 37Cl) why don't we observe J coupling between the 13C and the 35/37Cl like we do for the 13C and 2H?
Answer 1: The relaxation between the energy levels of the chlorine isotopes is very fast and the 13C "sees" each Cl at an average energy. 2H on the other hand relaxes slowly between the energy levels and the 13C "sees" all three energy states of the deuteron.
Question 2: Why don't we see an isotope shift between CD 35Cl3 and CD 37Cl3?
Answer 2: The effect is there ...... just too small to observe.
Tuesday, September 11, 2007
Poor Signal-to-Noise Ratio in Your Spectrum?
Have you ever colleccted NMR data and found that the signal-to-noise ratio was very poor even though you just KNOW that there is absolutely nothing wrong with your sample? If so, the following note may help you figure out the problem. The flow chart in the note is especially helpful.
Daniel D. Traficante, "Elementary Trouble-Shooting for Poor Sinal-to-Noise Ratios of NMR Spectrometers" Concepts in Magnetic Resonance, 2, 63 (1990).
http://scholarsportal.info/cgi-bin/sciserv.pl?collection=journals&journal=10437347&issue=v02i0002&article=63_etfpsrons
I must admit that when students come to me with poor signal-to-noise ratio problems, the first thing I check is the sample. Most often this is the problem as many people really have no idea how much sample they have in their tube or the sample is cloudy or has precipiate or is not filled properly or is paramagnetic or is a complex mixture......... If the sample appears OK, I use the logic in the note above to help isolate the problem.
Sunday, September 9, 2007
All Spectrometers Disabled After Unexpected Power Fluctuation
On Friday evening September 7th, there was a power fluctuation at the university which disabled all 6 of our NMR spectrometers. The instruments were all restarted on Saturday between 11:30 am and 1:30 pm. The NMR experiments on the AVANCE 400 which had errors were resubmitted to the queue. I restarted the experiments that were running on the ASX 200 and AVANCE 500. The student who was running the INOVA 500 should contact Cheryl. There did not seem to be any user of the AVANCE 300.
Friday, September 7, 2007
Detailed Chronological History of NMR Spectroscopy
Dave Bryce made me aware of a very detailed two part chronological list of references detailing the history of NMR spectroscopy from 1925 -1959. It is very interesting to look through this list of 526 references compiled by Stanislav Sykora to get a feel for how NMR spectroscopy took off.
Part 1 (1925-1955, 225 references)
http://www.ebyte.it/library/refs/Refs_NMR_EarlyHistory.html
Part 2 (1956-1959, 301 references)
http://www.ebyte.it/library/refs/Refs_NMR_EarlyHistory_II.html
Part 1 (1925-1955, 225 references)
http://www.ebyte.it/library/refs/Refs_NMR_EarlyHistory.html
Part 2 (1956-1959, 301 references)
http://www.ebyte.it/library/refs/Refs_NMR_EarlyHistory_II.html
Wednesday, September 5, 2007
NMR Acronyms
NMR spectroscopists have always given techniques acronyms (eg: COSY, NOESY, EXSY, PENIS, EBURP, MQMAS ... etc). Find out what they all mean here:
http://www.bmrb.wisc.edu/education/nmr_acronym.php
Hmmmmmm....... I see that "PENIS" is not listed on the above website. It stands for Proton Enhanced Nuclear Induction Spectroscopy. For reasons of political correctness, it is now called "CP" (Cross Polarization).
http://www.bmrb.wisc.edu/education/nmr_acronym.php
Hmmmmmm....... I see that "PENIS" is not listed on the above website. It stands for Proton Enhanced Nuclear Induction Spectroscopy. For reasons of political correctness, it is now called "CP" (Cross Polarization).
Tuesday, September 4, 2007
A Concentration Gradient Across Your Sample Leads to Poor NMR Data
While emptying the carousel of the AVANCE 400 daily, I notice that some samples have a concentration gradient (i.e. the sample is more concentrated at the bottom of the sample column compared to the top). The samples are not mixed. Such samples will always give NMR spectra of a lower than necessary quality. Why? - because the gradient shimming routine used on the spectrometer uses a magnetic resonance image of the deuterium concentration across the tube. If the concentration of the solvent is not constant across the sample volume, then the deuterium gradient shimming routine will not do well and you will get a poorly resolved spectrum. In fact you will also get a poor spectrum when manual shimming is carried out based on the lock signal.
Mix your samples well - get better data.
Mix your samples well - get better data.
Subscribe to:
Posts (Atom)
