Showing posts with label MAS. Show all posts

Friday, June 2, 2017

Testing an MAS Spin Detection Device

Recently, I had a problem with an MAS probe which would no longer allow measurement of an MAS spinning frequency.  I thought it might be instructive to describe the device and the steps I took to solve the problem.  An MAS spin detection device includes an IR LED source, an IR detector, a fiber-optic cable (split in two on one end), some electronics and an MAS speed controller.  Everything except the the MAS speed controller is shown in the figure below.
The spin detector is connected through a three-pin cable to the MAS speed controller from which it receives power and to which it sends information about the MAS rotor frequency.  The IR LED emitter inside the spin detector sends IR light through one leg of the split end of the fiber-optic cable.  The IR light passes through the fiber-optic cable where it is directed towards the bottom of the MAS rotor.  The position of the end of the fifer-optic cable with respect to the bottom of the rotor is very critical.  The IR light must strike the bottom to the rotor.  Half of the rotor bottom is marked with a black pen.  When the IR light strikes the dark side of the rotor, there is very little reflected IR light "seen" at the end of the fiber-optic cable near the rotor.  When the IR light strikes the white side of the rotor, most of the IR light is reflected back to the end of the fiber-optic cable and returned to the detector through one of the spit ends.  When the rotor is spinning an "off" - "on" binary pulse equal to the rotor spinning frequency is returned to the detector and sent to the MAS speed controller through the electronic cable.  If the device does not work, one possible problem could be that the fiber-optic cable is broken.  This can happen if the cable is fastened too tightly to a support rod in the probe.  It can be tested as shown in the figure below with a laser pointer or a flashlight.
Almost all of the light should pass through the fiber-optic cable.  Another possible problem could be a failing IR LED emitter.  Unfortunately, the IR light is not visible so you cannot just inspect it visually.  The IR light can however be detected by the front facing camera of an iPhone which does not have a built-in IR filter like the rear-facing camera.  Simply taking a picture with the front facing camera will indicate whether the emitter is working.  This is shown in the figure below, where the emitter is clearly visible when the spin detector receives power from the MAS speed controller but not visible when not connected to the MAS speed controller.
There could also be a problem with the detector.  This can be tested with a stroboscopic LED flashlight as shown in the figure below.
The strobe light is positioned at the end of the fiber-optic cable and one of the split ends is positioned at the detector.  When the spin detector is connected to the MAS speed controller, one should be able to observe the frequency of the strobe light on the rotor frequency display.  Other possible problems could be with the MAS speed controller or with the electronic cable.  I have two MAS probes for this instrument.  In one probe, the MAS spinning frequency could not be counted and in the other probe it could.  In the failing probe, the fiber-optic cable, IR LED emitter  and IR detector were all working properly.  The problem was with the connector on the cable between the spin detector and the MAS speed controller.  The connection was OK for one probe but not the other.  I will be happy if this post helps someone who may run into a similar problem.

Monday, December 21, 2015

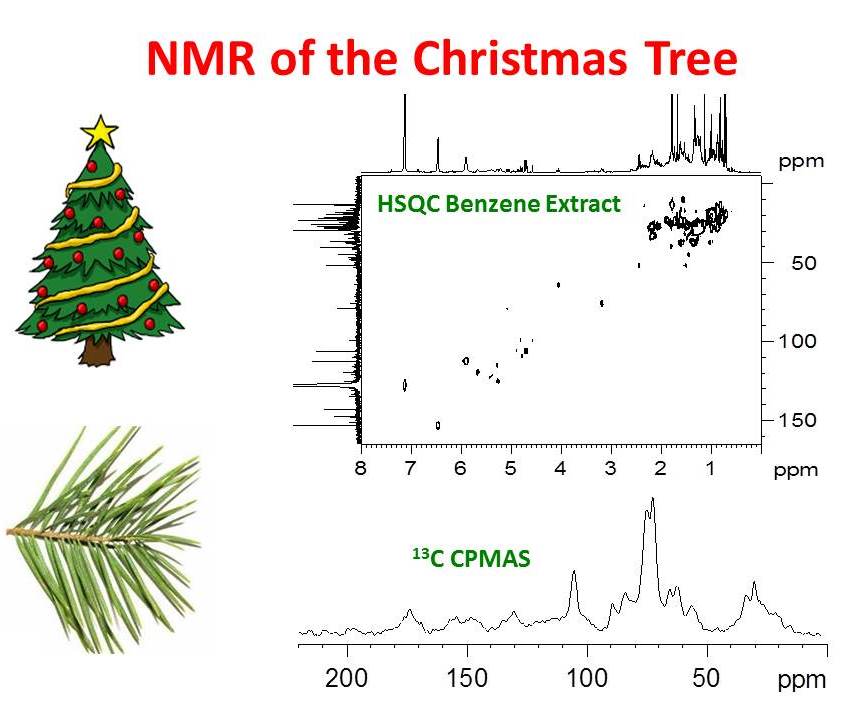
NMR of the Christmas Tree

One of my fondest memories as a child is the colorful lights and especially the smell of a decorated Christmas tree.  The hot incandescent lights used years ago would heat up the tree evaporating the fragrant compounds in the needles producing the very memorable and wonderful smell of Christmas.  Although modern artificial Christmas trees and cool LED lights have made the holiday season safer with respect to fires, they have taken much of the magic out of Christmas.  Among many other compounds, it is pinene, bornyl acetate and citronellol that contribute to the Christmas smell of evergreen needles.
We can use NMR spectroscopy to look for these compounds and perhaps recover a bit of the Christmas magic.  The bottom panel of the figure below shows the 13C CPMAS spectrum of spruce needles.  One can easily identify the signals from cellulose in the CPMAS spectrum of the needles while some of the smaller peaks can be attributed to fragrant compounds.  Many of the fragrant compounds in the needles are likely to be in a liquid-like state and not cross polarize very well.  These will either be absent or under-represented in the CPMAS spectrum.  The top panel of the figure shows the 1H - 13C HSQC spectrum of a benzene-d6 extract prepared from crushed spruce needles.  The top and left-side projections are the high resolution 1H and 13C NMR spectra, respectively.  This sample is expected to contain all of the benzene soluble compounds.  The spectrum is free of cellulose resonances and shows a mixture of fragrant compounds.
These data don't recover the childhood magic of Christmas but they do bring a little bit of joy to this NMR spectroscopist.

Merry Christmas  

Tuesday, March 1, 2011

MAS Rotor Crashes

There is no sound more pleasing to a solids NMR spectroscopist than that of an MAS rotor spinning stably. What happens though when the spinning is abruptly interrupted? This is called a rotor "crash" and when it occurs not only is the pleasing sound replaced by the horrible sound of rushing air, but one often finds damage to both the MAS rotor and the NMR probe. The picture below shows what used to be the solenoid coil of a 4 mm MAS probe after an unfortunate rotor crash. The rotor and sample were reduced to dust. Fortunately in this case the stator was not destroyed.

Here are a few tips to avoid expensive rotor crashes:
1. Spin only as fast as needed for your experiment. Just because your car can go 200 km/h does not mean that it should be driven at 200 km/h. Likewise, just because your probe is rated to spin samples at 15 kHz does not mean that all samples should be spun at 15 kHz.

2. Check the integrity of the rotor and the cap before use. Damaged rotors are weakened and should NEVER be used. Damaged caps can cause instability which may lead to a rotor crash.

3. Make sure the cap fits snugly on the rotor. A cap that lifts or comes off the rotor while spinning will cause a rotor crash.

4. Be aware of sample heating due to spinning. The rotor and sample heat up during spinning due to friction. If the temperature increases such that your sample melts or emits a gas, the rotor may become unbalanced or the cap may be forced off causing a rotor crash.

5. Make sure the rotor is marked properly so the speed can be monitored and regulated. Failure to do this may result in the spin counter receiving a bogus signal and it is possible that the rotor may spin faster than its rated speed causing a crash.

6. Pack your sample evenly to ensure that the rotor is properly balanced during MAS. Rotors that do not spin smoothly and stably should be repacked until they do.

7. Start and stop the rotor gradually to ensure stability while speeding up or slowing down.

Wednesday, January 21, 2009

The Effect of Magic Angle Spinning and High Power 1H Decoupling on 13C Cross Polarization NMR Experiments

Cross polarization (CP), magic angle spinning (MAS) and high power 1H decoupling are all routine methods used in solid state NMR experiments. It is useful to see the effect of each of these techniques on a solid sample. The figure below shows 13C cross polarization NMR spectra of glycine at 4.7 Tesla collected with various combinations of magic angle spinning and high power 1H decoupling.The bottom spectrum was collected with neither MAS nor high power 1H decoupling. One can see two very broad overlapping lines due to the carbonyl and methylene carbons. The broadening is due to chemical shielding anisotropy and heteronuclear dipolar coupling between the 13C and both 1H and 14N. The second trace from the bottom was collected with high power 1H decoupling but no magic angle spinning. The spectrum contains two broad resonances with very informative line shapes. The high power 1H decoupling effectively removes the 13C - 1H heteronuclear dipolar interaction. The line shapes are determined from the chemical shielding anisotropy and 13C - 14N dipolar coupling interactions. The second trace from the top was collected with magic angle spinning at 4.5 kHz but no high power 1H decoupling. The spectrum apparently contains only one broad resonance with spinning sidebands. The magic angle spinning effectively removes the 13C chemical shielding anisotropy interaction. Although MAS does help average the 13C - 1H heteronuclear dipolar interaction, the averaging is not very effective at a speed of 4.5 kHz. Also, MAS only partially averages the 13C - 14N heteronuclear dipolar interaction. The resonances are therefore broadened out by residual heteronuclear dipolar coupling. The methylene resonance is broadened to such an extent that it does not show up in the spectrum at all. The top spectrum was collected with both MAS and high power 1H decoupling. One can see two very sharp resonances due to the carbonyl and methylene carbons. The 13C chemical shielding anisotropy and 13C - 1H heteronuclear dipolar coupling interactions are effectively removed by the MAS and high power 1H decoupling, respectively. Since MAS does not average J coupling and only partially averages dipolar coupling between a spin I = 1/2 and quadrupolar nucleus, the methylene carbon shows fine structure due to both J coupling and residual 13C - 14N dipolar coupling (see inset in yellow).

Friday, August 22, 2008

The Fourier Transform of a Single Rotational Echo

The spinning sidebands in MAS NMR spectra are the result of rotational echos in the free induction decay. These echos show up as spikes in the free induction decay (and can be used conveniently to set the magic angle). The intensity envelope of the spinning sideband manifold in the NMR spectrum mimics the static wideline spectrum. One can obtain an NMR spectrum similar to the wideline spectrum from MAS data by Fourier transforming a single rotational echo rather than the entire FID. This is illustrated in the figure below for the 27Al MAS data for kaolinite at 21.1 Tesla.

Friday, August 8, 2008

Setting the Magic Angle with Glycine

One of the most precise ways of setting the magic angle is to maximize the number of rotational echos in the FID of a suitable spin I = n/2 quadrupolar nucleus (n =3, 5, 7 ....). When setting up for 13C CPMAS, one usually uses the 79Br resonance of KBr as the resonance frequency of 79Br is very close to that of 13C. An alternative method of setting the magic angle is to use the 13C carbonyl resonance of glycine. This has the advantage in that the glycine can also be used to set the Hartman Hahn matching condition and to check the decoupling power. The width of the carbonyl resonance is very sensitive to the setting of the magic angle. The angle can easily be adjusted and set properly while maximizing the duration of the signal in the FID interactively. The figure below shows the 13C CPMAS FID and spectrum for glycine on- and off-angle with digital filtering such that the methylene resonance is outside of the spectral width. The spectra were collected at 11.7 Tesla using a spinning speed of 12 kHz. When the angle is mis-set, one can see that the line shape for the resonance is a miniature version of the powder pattern observed in the absence of magic angle spinning.

Tuesday, June 17, 2008

The Available RF Field for MAS NMR Probes

In order to rotate an equilibrium magnetization vector from the z axis into the transverse plane, one must provide a pulse with an oscillating magnetic field transverse the static field, Bo, at the Larmor frequency of the nucleus being observed. This is usually provided with a vertically oriented Helmholtz coil for liquids and a horizontal solenoid coil for solids. In both cases the coils provide radio frequency fields transverse to the static magnetic field. MAS coils are solenoids oriented at 54.7 degrees from the static magnetic field. They produce an oscillating radio frequency field at the magic angle. It is only the horizontal component of this field which is capable of rotating magnetization vectors. The available radio frequency field is therefore only 82% of that compared to an identical horizontal solenoid coil.

Monday, June 2, 2008

The Effect of Spinning Speed on Dipolar Dephasing

Dipolar dephasing is a very simple and effective tool to help assign the 13C CPMAS spectra of solid organic compounds. The technique is based on turning off the high power 1H decoupler for a period of time immediately after cross polarization but prior to the collection of the FID. During this dephasing delay, the 13C - 1H heteronuclear dipolar interaction is averaged only by the magic angle spinning. The degree of averaging of the 13C - 1H dipolar interaction and hence the amount of dipolar dephasing, depends on the MAS spinning speed. The faster the spinning speed, the smaller the amount of dephasing for a fixed period of time. This is illustrated in the figure below. The lower trace shows a 13C CPMAS spectrum with a spinning speed of 12 kHz. The center trace shows the 13C CPMAS spectrum with a 40 microsecond dephasing delay with a spinning speed of 4 kHz. The upper trace is identical to the center trace except the rotor was spinning at 12 kHz. One can see that many of the resonances which did not survive the dephasing delay at 4 kHz are present in the dipolar dephasing spectrum at 12 kHz. When fast spinning speeds are employed, longer dephasing delays (and the complications encountered with them) are required.

Wednesday, April 16, 2008

How Much Sample Do I Need to Get a Solid State MAS NMR Spectrum?

Synthetic chemists frequently ask how much sample they need in order to get a solid state magic angle spinning spectrum. The answer is not simple and of course depends on what nucleus is to be observed, the field strength, what type of NMR experiment is needed and at what spinning speed the rotor must be set. The signal-to-noise ratio is directly proportional to the quantity of sample, so in principle, the larger the rotor, the higher the signal-to-noise ratio. This would be true if all rotors were able to spin at the rate needed for the experiment. Unfortunately, this is not the case and we are often limited by how fast we can spin the sample. The smaller the rotor - the faster the maximum available spinning speed. Often, one wants to maximize the quantity of sample (large rotors) yet employ the fastest possible spinning speeds (small rotors). A compromise must be made. The picture below (courtesy of Victor Terskikh) nicely shows the sizes of the common Bruker MAS rotors and gives an idea of the volumes of solid needed to fill the rotors.
From left to right the diameters are 7 mm, 4 mm, 3.2 mm, 2.5 mm and 1.3 mm. All of these rotor sizes are available at the National Ultrahigh Field NMR Facility for Solids. the maximum spinning speeds from left to right are 8 kHz, 18 kHz, 23 kHz, 35 kHz and 70 kHz, respectively. At the NMR Facility on the Ottawa U campus, the 7 mm, 4 mm and 2.5 mm sizes are available with maximum spinning speeds of 7 kHz, 15 kHz and 30 kHz, respectively.

Tuesday, March 25, 2008

Solution vs Solid State MAS NMR

The number of peaks present in a standard 13C solution state NMR spectrum with proton decoupling depends on the number of symmetry independant carbon atoms present in the molecule. If the molecule has no symmetry then the number of peaks equals the number of different types of carbon in the molecule. When the molecule has symmetry, the number of 13C resonances is reduced by the symmetry. The molecular symmetry determines the number of resonances. In the solid state, on the other hand, the molecules are part of a crystal lattice. In solids it is the crystallographic symmetry rather than the molecular symmetry that determines the number of peaks in the spectrum. There will be a resonance for each carbon in the asymmetric unit of the crystal. This is illustrated in the figure below. In this case, for the solution state spectrum, there is half as many 13C resonances as there are carbon atoms due to the molecular symmetry. In the solid, there is one entire molecule in the asymmetric unit of the crystal therefore the 13C CPMAS spectrum has one peak for each carbon in the molecule.

Wednesday, February 27, 2008

Hartmann-Hahn Match as a Function of MAS Spinning Speed

Cross polarization with magic angle spinning (CPMAS) is a means of obtaining high resolution, high sensitivity NMR spectra of dilute isotopes in solids. The dipolar coupling between the protons and the dilute isotope to be observed ( typically 13C, 15N, 29Si etc....) is exploited as a means for magnetization transfer from the abundant protons to the dilute isotope. The transfer is only possible when the product of the gyromagnetic ratio and applied power for the dilute isotope equals the product of the gyromagnetic ratio and applied power for the protons. For static or slow spinning samples, one can vary either the X or 1H power level during the contact time and one will observe a maximum signal when the Hartmann-Hahn condition is met. The situation is more complicated when a sample is spinning at a rate comparable to or faster than the magnitude of the heteronuclear dipolar coupling used for the magnetization transfer. In such a case the MAS interferes with the dipolar coupling. The effect is that the Harmann Hahn matching curve (intensity vs X or 1H power) is split into a series of maxima and minima separated by the spinning speed. This is illustrated in the figure below. When fast MAS CP experiments are to be used, it is important to set up the Hartmann-Hahn condition on a maximum for a standard sample at the same spinning speed to be used for the sample of interest.

Friday, February 15, 2008

Setting the Magic Angle

High resolution solid state NMR employs a technique called "Magic Angle Spinning" where the sample is spun at an angle of 54.736 degrees with respect to the magnetic field at a rate fast with respect to the interactions being averaged. In order to achieve high resolution, the angle must be set very precisely. This is commonly done by looking at the 79Br signal of KBr. The intensity of the spinning sidebands for the satellite transition of the I = 3/2 79Br is strongly related to the precision of the magic angle. The sidebands appear as rotational echos in the 79Br FID. The more rotational echoes - the stronger the sidebands and therefore the more precise the angle setting. Although any quadrupolar isotope with strong satellite transition sidebands can be used for this purpose, the 79Br of KBr is particularly convenient as the resonance is very close to 13C, has a short T1, and can be seen easily in one scan. The spectrometer is set up to scan without adding the signals and the angle adjustment is made while observing the FID until a maximum number or rotational echos is observed.

Friday, January 25, 2008

Spinning Sideband Suppression in Solid State MAS NMR

In the MAS or CPMAS NMR spectra of solids, it may be difficult to distinguish between an isotropic peak and a spinning sideband or the spinning sidebands from one resonance may overlap with the isotropic peak of others. This tends to complicate the analysis of the data. One simple approach to alleviate these problems is to collect two spectra at different spinning speeds. The sidebands will occur at different frequencies whereas, the isotropic peaks will remain at the same frequency. An alternative to this approach is to use a pulse sequence to suppress the spinning sidebands leaving only the isotropic peaks. The most common of these sequences is the TOSS ( TOtal Suppression of Spinning sidebands) sequence (Dixon et. al., J. Magn. Reson. 49, 341 (1982)). In this approach four properly timed 180 degree pulses are applied before the acquisition of the FID. These pulses have the effect of randomizing the phases of the spinning sidebands while preserving the phase of the isotropic resonances. The figure below illustrates the use of this sequence. The lower trace is the 50 MHz 13C CPMAS spectrum of the ethanol inclusion of Dianin's compound with a spinning speed of 2500 Hz. The upper trace is the comparable 13C CPMAS-TOSS spectrum.

Tuesday, November 27, 2007

How Fast Should I Spin My Solid Sample?

The choice of MAS rate depends on the interaction to be averaged by the magic angle spinning. If you want to average out the chemical shielding anisotropy then you must spin the sample at a rate comparable to or greater than the span of the chemical shift tensor expressed in Hz. Although the spans of chemical shift tensors, measured in ppm, are independent of field strength they are linearly dependent on field strength, when expressed in Hz. As a result, an appropriate spinning speed in one magnet may not be an appropriate spinning speed for the same sample in another magnet. The spectra below illustrate this point. Both are 31P CPMAS spectra of dibasic ammonium phosphate with a spinning speed of 4 kHz. The lower trace was acquired at 11,75 Tesla while the upper trace was collected at 4.7 Tesla. One can see that there are many more spinning sidebands in the spectrum acquired at higher field despite the identical spinning speeds.One would have to spin the sample at 10 kHz in an 11.75 Tesla magnet to get a spectrum comparable to the one acquired with a spinning speed of 4 kHz in a 4.7 Tesla magnet.

Wednesday, November 21, 2007

Magic Angle Spinning

The NMR spectra of solids generally have very broad lines due to a number of interactions which are averaged either to zero or an isotropic value in solution. It is the averaging of these interactions which leads to the narrow lines observed in liquids. The rapid random motion responsible for the averaging in solution is not present for solids, however, it can be mimicked by spinning the sample about an angle of 54.7 degrees with respect to the magnetic field at a rate comparable to or greater than the extent of the interaction being averaged. This technique is called magic angle spinning (MAS) and it allows the measurement of high resolution spectra of solids. When the spinning rate is less than the extent of the interaction, the spectrum is split into sidebands spaced at the spinning speed. In the figure below are 81 MHz 31P CPMAS spectra of ammonium dihydrogen phosphate with high power proton decoupling at various spinning rates. When the spinning speed is zero, one can see the powder spectrum characterizing the chemical shift interaction. As the spinning speed is increased, there is a centerband at the isotropic chemical shift with sidebands whose intensities can be used to calculate the chemical shift tensor. When the spinning speed exceeds the span of the chemical shift interaction the sidebands are very small and a liquid-like spectrum is obtained.

Monday, November 19, 2007

Increasing the Signal-to-Noise Ratio in Solids MAS Spectra

Often MAS or CPMAS NMR spectra of solids will have several spinning sidebands. In such spectra, where there are no other complications, one can increase the signal-to-noise ratio for the isotropic signals by simply adding the sideband intensity to the isotropic spectrum. Below is a 50.68 MHz, room temperature, 15N CPMAS spectrum of a clay sample which absorbed some 15N labelled pyridine and then was heated to 400 degrees. The spinning speed was set to 2.5 kHz. The full spectrum is shown in the bottom panel. The isotropic region is shown on the top left panel. The spectrum in the top right panel was obtained by shifting the spectrum by multiples of the spinning speed and adding the shifted spectra to the original spectrum. Note that the isotropic region of the spectrum has a much improved signal-to-noise ratio.