Showing posts with label NOESY. Show all posts

Thursday, November 15, 2012

19F NOESY

Two-dimensional 1H NOESY data are routinely used to assign specific stereo-isomers based on the proton nuclear Overhauser effects (NOE's) which are strongly correlated to inter-proton distances through space.  For example, NOE's may be observed for cis- protons across a double bond but not observed for trans- protons.  The same technique can be used with 19F in fluorinated compounds to gauge the inter-fluorine distance and assign stereochemistry.  The figure below shows the 19F NOESY spectrum of a fluorine containing cobalt complex.

From the 1D-19F NMR spectrum, it is not clear which fluorine atoms are on the same or opposite sides of the four membered cobalt containing ring.  The 2D-19F NOESY spectrum, on the other hand, shows strong NOE cross peaks between fluorine C and both A and E indicating that C, A and E are on the same side of the ring.  There are also strong cross peaks between fluorine D, and both B and F indicating that D, B anf F are on the same side of the ring.
Thank you to Graham Lee (of Dr. R.T. Baker's research group at the University of Ottawa) for kindly providing the sample and sharing his data. 

Friday, October 28, 2011

The Effect of Viscosity on 1H NOESY Spectra

For small molecules, 1H 2D NOESY spectra exhibit positive NOE's between protons close to one another in space and the off-diagonal correlations are opposite in phase to those of the diagonals. As molecules become larger and larger the motional correlation times become longer and longer. As the correlation times become longer and longer, the NOE's become less positive, cross zero and then become negative. For large molecules, like proteins, the NOE's are negative and the off-diagonal correlations between close protons are of the same phase as the diagonal peaks. When the correlation times are extremely long, for example in rigid macromolecules or solids, the dipolar coupling among all of the protons is inefficiently averaged by molecular motions and spin diffusion becomes efficient. Spin diffusion allows all of the protons in a dipolar coupled network to exhibit correlations with one another. The sign of the correlations is similar to that observed for chemical exchange or negative NOE's. This phenomenon is demonstrated in the figure below. In the figure, positive contours are represented in black and negative contours are represented in red. The NOESY spectrum on the left is that of a solution of menthol in CDCl3. The off-diagonal correlations between proximate protons is opposite in phase compared to the diagonal responses, typical of small molecules with short correlation times. The NOESY spectrum on the right is that of the same solution of menthol dissolved in a very viscous fluorinated oil. The extreme viscosity of the sample is sufficient to make the correlation time for the molecules very long such that the menthol behaves like a very large macromolecule where spin diffusion is efficient. As a result, off-diagonal responses are of the same phase as those of the diagonal and are observed between all protons in the molecule.This technique has been cleverly applied* to mixtures of molecules immersed in viscous oils where intra-molecular correlations are observed whereas inter-molecular correlations are not observed. The data allow for the observation of the constituent components of complex mixtures.


* Andre J. Simpson, Gwen Woods, and Omid Mehrzad, Anal. Chem, 80, 186-194 (2008).

Thursday, July 24, 2008

What are Those Positive Peaks in My NOESY Spectrum?

Students will sometimes ask me, "What are those positive off-diagonal peaks in my NOESY spectrum?". Since the NOESY pulse sequence is exactly the same as the EXSY sequence, a NOESY spectrum will show all possible correlations due to cross relaxation. These correlations include those from NOE's, chemical exchange and conformational (or rotational) exchange. For small molecules, if one phases the diagonal responses such that they are positive, the NOE's correlations will be negative and the exchange correlations will be positive. The answer to the question is therefore that the positive peaks are due to exchange. The figure below shows an example where three different types of cross peaks are visible. The molecule in the figure has two distinct rotational conformations in slow exchange with one another and gives a proton spectrum with every resonance doubled. Each resonance for one rotational conformation gives a positive (black) cross peak correlating it to the corresponding resonance of the other conformation. There is also a positive cross peak correlating the -NH- proton in the molecule to the residual water in the DMSO-d6 solvent. These protons exchange chemically with one another. Finally, the negative (red) correlations in the figure are due to NOE's.
Thank you to Jean-Gregoire Roveda of Dr. Beauchemin's group for giving me permission to use his spectrum as an example.

Friday, April 11, 2008

Phasing 2D NOESY Data in TOPSPIN

In order to have a high quality 2D NOESY spectrum, both the F2 domain (rows) and F1 domain (columns) must be phased. After Fourier transforming your data with the xfb command, phase it by following these steps:

Phasing the rows manually
1. Click the interactive phase correction icon in the top symbolic menu bar.
2. Position the cross hair cursor on a diagonal peak near the top of the spectrum and then click the right mouse button. From the sub-menu that appears, click the add option.
3. Repeat step 2 for a prominent row near the center of the spectrum and for a prominent row near the bottom of the spectrum.
4. Click on the blue R icon in the data window. You should now see the three rows you have chosen on the screen with a vertical red cursor on the largest peak.
5. Click and hold down the left mouse button on the 0 icon in the data window. While holding down the left mouse button, drag the mouse up and down until the resonance at the red cursor is in phase. (Remember that for the NOESY spectra of small molecules the diagonals and off-diagonals should be opposite in phase).
6. Click and hold down the left mouse button on the 1 icon in the data window. While holding down the left mouse button, drag the mouse up and down until the resonances away from the red cursor are in phase.
7. Click the save and return icon in the data window. You will be returned to the NOESY spectrum and the rows will now be phased.

Phasing the columns manually
8. Click on the blue C icon in the data window. You should now see the three columns you have chosen on the screen (displayed horizontally) with a vertical red cursor on the largest peak.
9. Click and hold down the left mouse button on the 0 icon in the data window. While holding down the left mouse button, drag the mouse up and down until the resonance at the red cursor is in phase. (Remember that for NOESY spectra of small molecules the diagonals and off-diagonals should be opposite in phase).
10. Click and hold down the left mouse button on the 1 icon in the data window. While holding down the left mouse button, drag the mouse up and down until the resonances away from the red cursor are in phase.
11. Click the save and return icon in the data window. You will be returned to the NOESY spectrum and the columns will now be phased.
12. Click the return icon to exit the interactive phase correction routine.

Rather than phasing the rows manually, you can also phase them automatically by doing the following: (note that you will usually achieve better phase correction by phasing manually)

Phasing the rows automatically
1. Click on the ProcPars tab and under phase correction make sure that PH_mod is set to pk in both the F2 and F1 domains.
2. Click the Spectrum tab to return to the spectrum.
3. You can autophase the rows by typing calcphhomo.
4. Type xfb to Fourier trannsform you data. The rows should now be phased.
5. Phase the columns manually as described above.

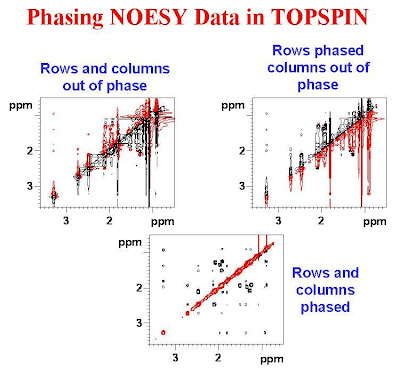
The figure below shows a NOESY spectrum with both the rows and columns out of phase in the top left panel, the rows phased and the columns out of phase in the top right panel and both the rows and columns phased in the bottom panel. In this figure red is negative and black is positive.

Tuesday, February 26, 2008

NOESY vs ROESY for Large Molecules.

NOESY experiments work well for molecules of very low and very high molecular weight. They do not work well for molecules with molecular weights of approximately 1000 - 2000 g/mol at typical field strengths, where the NOE's are very close to zero. A ROESY experiment can be used to get NOE information for molecule in this intermediate molecular mass regime. For high molecular weight molecules a NOESY and a ROESY experiment will give very similar results with the exception that the cross peaks will be in phase with respect to the diagonals for a NOESY and 180 degrees out of phase with the diagonals in the case of a ROESY. The figure below shows both a NOESY and a ROESY for gramacidin at 300 MHz The red contours are negative and the black contours are positive.

Thursday, January 24, 2008

NOESY: Small Molecules vs Large Molecules

2D NOESY (Nuclear Overhauser Effect SpectroscopY) experiments are used extensively to study the conformation of molecules both small and large. In such experiments correlations exist between protons that are close to one another in space. The intensity of the correlations also depends on the molecular weight of the compound being studied. Fast moving (small) molecules have positive NOE's for protons in close proximity, whereas slow moving (large) molecules have negative NOE's. For molecules of an intermediate mass (1000 g/mol - 1500 g/mol), the NOE's are very close to zero at commonly used magnetic field strengths. The figure below illustrates that in the NOESY experiment, small molecules will exhibit cross peaks of opposite sign to the diagonal (positive NOE's) while large molecules will exhibit cross peaks of the same sign as the diagonal (negative NOE's).

Tuesday, November 13, 2007

What Mixing Time Should I Use for My 2D-NOESY Measurements?

NOEs are often very small and the appropriate choice of mixing time is a critical factor in achieving good NOESY spectra. There are two opposing factors which must be considered when choosing the most appropriate mixing time. Firstly, you would like the NOE to build up for as long as possible during the mixing time and secondly, you want to loose as little signal as possible to relaxation during the mixing time. The best compromise is to choose a mixing time equal to the average T1 relaxation times for the signals in which you are interested. (See the BLOG entry for October 31, 2007, to learn how to estimate T1's.)
If the standard pulse programs are used, the mixing time is the "d8" parameter on a Bruker spectrometer and the "mix" parameter on a Varian spectrometer.