
Showing posts with label apodization. Show all posts
Showing posts with label apodization. Show all posts
Tuesday, July 15, 2008
Apodization of 2D Data
In the interest of data collection time and disk storage space, 2D data sets are often collected with short t2 acquisition times and as few as possible t1 slices. In such cases, the FID's in the t2 domain do not decay into the noise and the interferograms in the t1 domain do not decay completely. Applying a 2D Fourier transform to such truncated data will cause ripples in the 2D frequency domain spectrum analogous to those observed in 1D spectra where the acquisition time is too short. The application of an appropriate apodization function (and/or forward linear prediction) to the t2 and t1 domains is important to produce high quality spectra. The figure below illustrates the effect of the more common apodization functions on the cross peak in the phase sensitive COSY spectrum of ethyl acetate. The panel on the upper left shows the appearance of the cross peak when no apodization is applied. One can easily see the ripples in both the F2 and F1 frequency domains. The panel on the upper right shows the effect of applying a 2 Hz exponential line broadening function to each domain. The data are improved but the ripples are still visible. The panel on the lower left shows the effect of applying a sine bell weighting function with the maximum at the midpoint of each of the t2 and t1 domains. This apodization function is suitable for magnitude mode data where the phase is irrelevant. In this example of a phase sensitive data set, one can see a major distortion in the cross peak. The panel on the lower right shows the effect of using a sine squared weighting function with the maximum at the beginning of the t2 and t1 signals. The spectrum is free of ripples and clearly shows the phase information.


Wednesday, September 19, 2007
Exponential Line Broadening
If you have a spectrum with a poor signal-to-noise ratio or a spectrum containing a very broad resonance (due to slow molecular motion for example), you will probably be able to get higher quality data by using exponential line broadening. This is a very common data processing technique where the FID is multiplied by a decaying exponential function (the Fourier transform of which is a Lorentzian line with a full width at half height of LB). The larger LB, the faster the decay of the exponential. The product of the FID with the exponentially decaying function is Fourier transformed to give the NMR spectrum.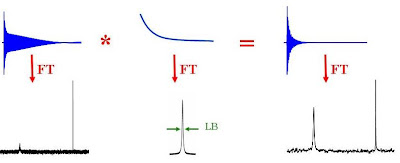 Since the signal-to-noise ratio of the FID is worse near the end than at the beginning, multiplying by the exponential decay effectively improves the overall signal to noise ratio. Broad signals tend to show up better as broad lines have very rapidly decaying FID's and hence the multiplication of the FID by an exponential emphasizes the faster decaying components of the FID.
Since the signal-to-noise ratio of the FID is worse near the end than at the beginning, multiplying by the exponential decay effectively improves the overall signal to noise ratio. Broad signals tend to show up better as broad lines have very rapidly decaying FID's and hence the multiplication of the FID by an exponential emphasizes the faster decaying components of the FID.
All things come at a price. Application of exponential line broadening will decrease the resolution in your NMR spectrum.
How do I use it intelligently?
In TOPSPIN or XWINNMR type:
"lb 0"
"lb 0"
"efp"
"apk"
Using the cursors, measure the line width at half height of the narrowest line of interest. Input approximately 75% of this value as "lb". For example, if the narrowest line of interest was 1 Hz, set lb to 0.75.
type:
"lb=0.75"
"efp"
"apk"
Monday, September 17, 2007
Resolution Enhancement
If you have a partially resolved multiplet or partially resolved chemical shifts, you can enhance the resolution in the spectrum by treating your free induction decay with exponential and Gaussian functions before Fourier transformation. The upper trace of the figure below is the proton spectrum of benzene-d5 (i.e. C6D5H). The lower trace is the same data after treatment of the FID with a mixture of Gaussian and exponential functions. The signal in the resolution enhanced spectum shows the expected 1:2:3:2:1 multiplet due to H-D coupling. The enhancement of resolution is at the expense of the signal-to-noise ratio and quantitation. You can easily use this for your own data using TOPSPIN or XWINNMR as follows:
"lb -1" (The more negative lb - the more resolution enhancement)
"gb 0.4" (gb is a value between 0 and 1. The larger the number, the more resolution enhancement)
"gm" (This command calculates the Gaussian weighted FID)
"ft" (This command carries out the Fourier transform)
"apk" (This command calculates the proper phase correction. You may have to phase the spectrum manually)
Try it on your own data with different values of "lb" and "gb" to get a feel for what it can do for you.
To learn more about what you are doing, read the online TOPSPIN manual or take CHM 4380/8309B.
You can easily use this for your own data using TOPSPIN or XWINNMR as follows:"lb -1" (The more negative lb - the more resolution enhancement)
"gb 0.4" (gb is a value between 0 and 1. The larger the number, the more resolution enhancement)
"gm" (This command calculates the Gaussian weighted FID)
"ft" (This command carries out the Fourier transform)
"apk" (This command calculates the proper phase correction. You may have to phase the spectrum manually)
Try it on your own data with different values of "lb" and "gb" to get a feel for what it can do for you.
To learn more about what you are doing, read the online TOPSPIN manual or take CHM 4380/8309B.
Subscribe to:
Posts (Atom)
